Remember [that April post agonizing over device choices]? Back then I listed a bunch of candidates, weighed them one by one, and confidently declared I would “stick with the Fydetab Duo.” Well… it turns out humans can’t escape the universal law of zhen xiang (something you dismissed turns out to be great), and in the end I bought the MacBook Neo after all.
SylensHub
Eating, sleeping, and gaming!
The Benefits and Limitations of Claude Science
After previously tinkering with putting Claude Science into a Docker container, I’ve been using it relatively intensively over the past two weeks (connected to DeepSeek, not the original Anthropic version, of course), so I want to talk about its advantages and limitations.
Putting Claude Science into a Docker Container
I recently worked on a small project: putting the Linux version of Claude Science into a Docker container, paired with an API Bridge so it can run through third-party API backends without needing to hold an Anthropic API Key directly.
The process was more eventful than expected—also quite interesting. Here’s a record of it.
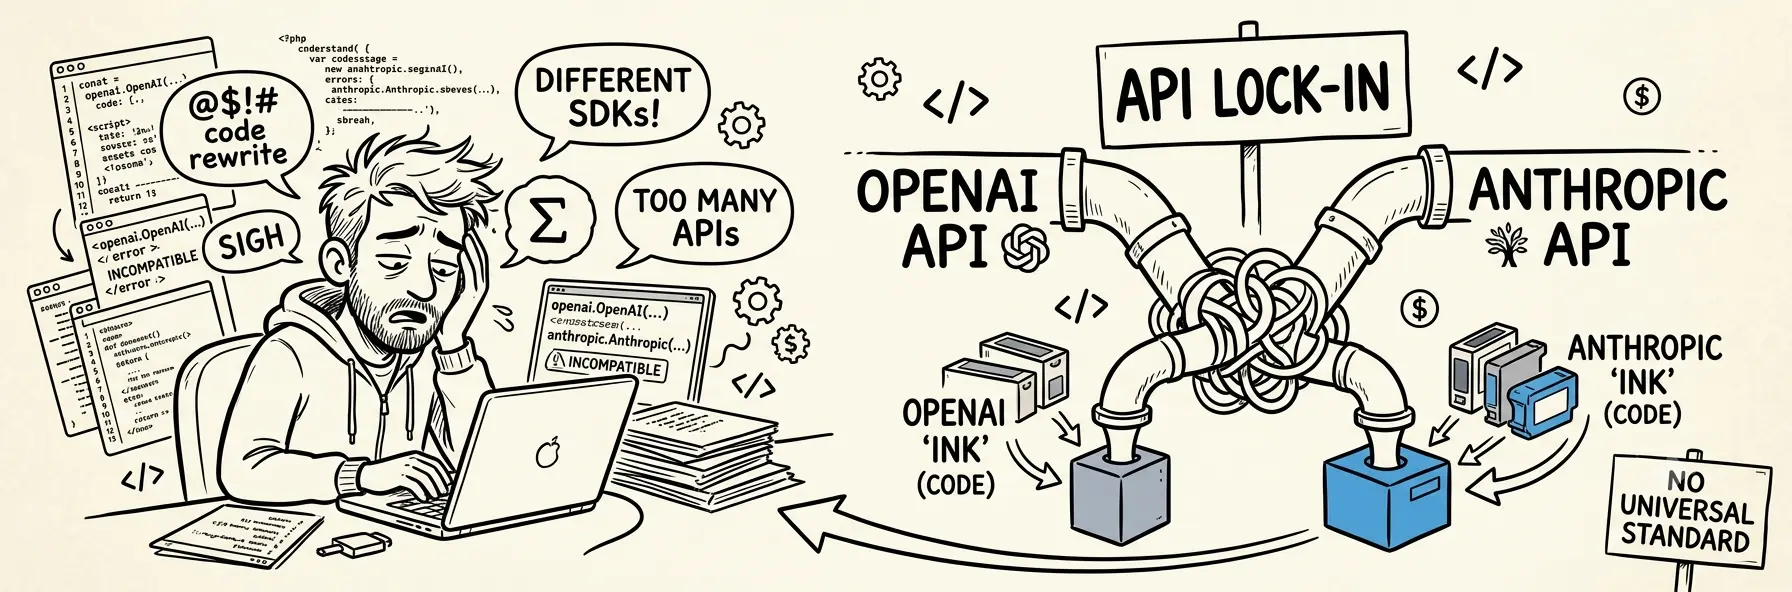
API Incompatibility – OpenAI and Anthropic's "Printer Ink Monopoly" Strategy
Lately I’ve been working on integrating several AI applications, which means I need to switch between different models. That’s when I discovered a problem — the APIs of OpenAI and Anthropic are incompatible.
Hardware is getting more expensive, but maybe that's a good thing
Recently, I chatted with friends about the devices we each want to buy, and we all shared the same feeling — everything is getting more expensive. Game consoles, graphics cards, RAM, SSDs, even laptops that used to be relatively affordable — the prices now are enough to make anyone hesitate.
The World Changes Fast – LeanCloud Is Shutting Down
Yesterday I got an email from LeanCloud saying they’re shutting down service…. Wait, what?
Blog Reads Reached 50k Again
I had been thinking that when my blog’s total page views hit 50,000 again, I’d write a celebratory post. Little did I expect that the clicks would grow much faster than I imagined — before I could even finish drafting the celebration, the number had already blown past it.
MoFang Apartment is Going Under: Worked a Decade, None of My Companies Folded, but My Apartment Did
I’ve been living at MoFang Apartment for almost three years. What I got wasn’t a renewal notice — it was news that the company’s funding chain had snapped and they were on the verge of bankruptcy.
Things to Note When Using a Mac Mini as a Server
I recently got a Mac Mini to use as a server. I initially thought that since macOS is based on Unix, it would be pretty much like Linux — just set it up and go. But once I actually started using it, I ran into quite a few pitfalls. Here’s a record of the main issues.
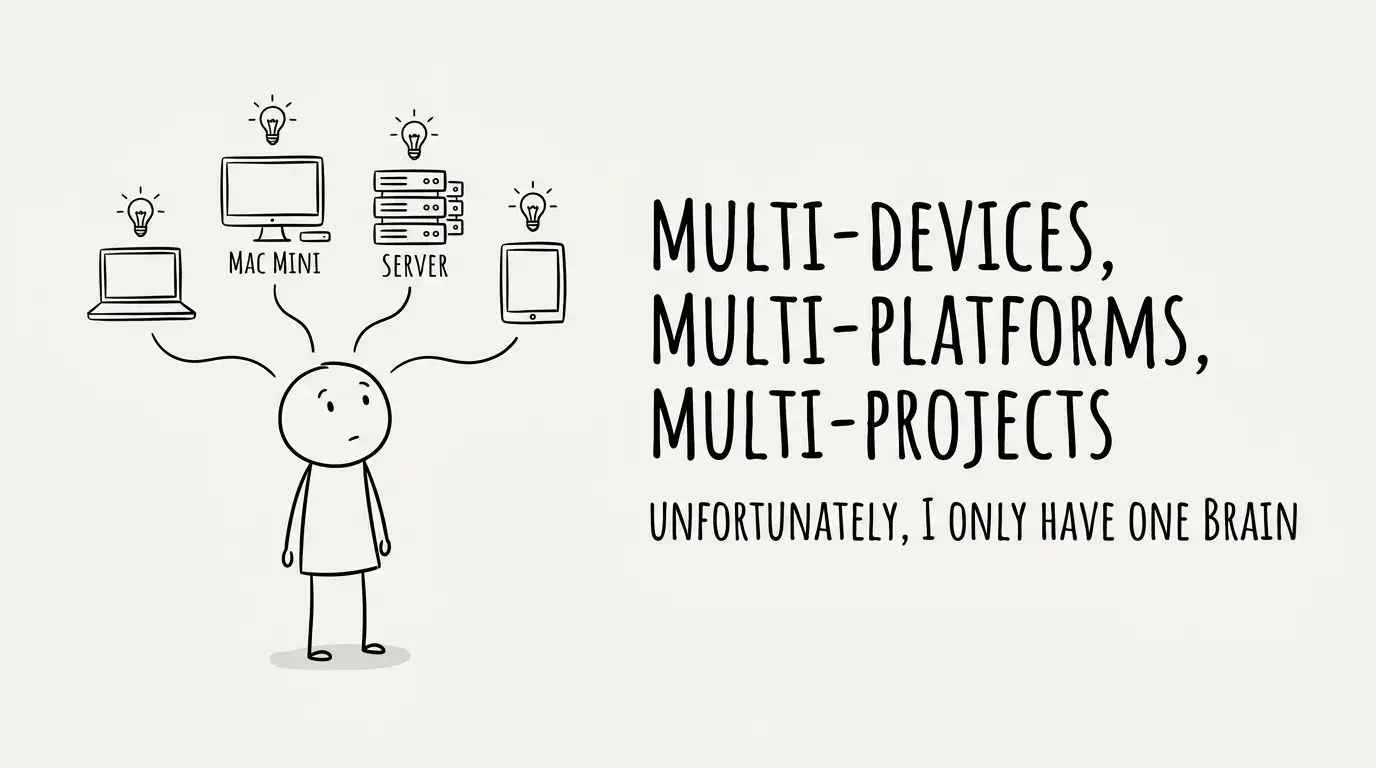
Multiple Devices, Multiple Platforms, Multiple Projects — Too Bad I Don't Have Multiple Brains
To do some small-scale model training at work, I eventually recommended buying a Mac Mini. The reasoning wasn’t complicated: I needed it for bioinformatics analysis, running agent deployments, and occasionally training models with modest parameter counts — these scenarios are exactly where M-series chips with unified memory shine. The cost of separate RAM plus a large-VRAM GPU far exceeds the Mac platform; do the math and the choice is clear.
And just like that, I unlocked the achievement of pushing forward multiple devices, multiple platforms, and multiple projects all at once.
1 / 20