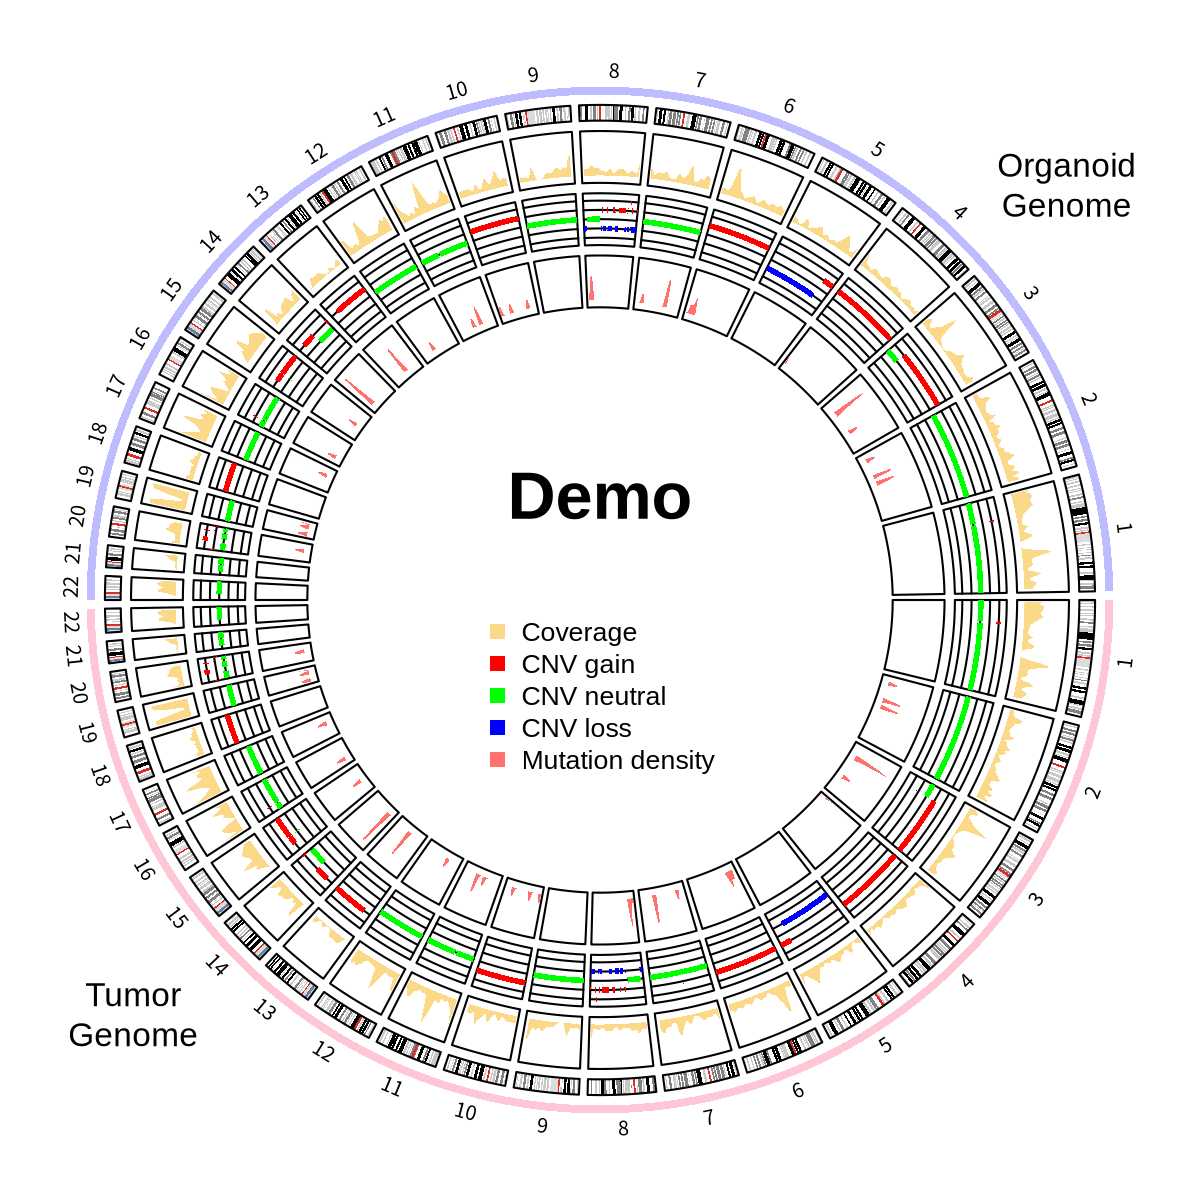
1
2
3
4
5
6
7
8
9
10
11
12
13
14
15
16
17
18
19
20
21
22
23
24
25
26
27
28
29
30
31
32
33
34
35
36
37
38
39
40
41
42
43
44
45
46
47
48
49
50
51
52
53
54
55
56
57
58
59
60
61
62
63
64
65
66
67
68
69
70
71
72
73
74
75
76
77
78
79
80
81
82
83
84
85
86
87
88
89
90
91
92
93
94
95
96
97
98
99
100
101
102
103
104
105
106
107
108
109
110
111
112
113
114
115
116
117
118
119
120
121
122
123
124
125
126
127
128
129
130
131
132
133
134
135
136
137
138
139
140
141
142
143
144
| library(circlize)
library(dplyr)
library(stringr)
library(MutationalPatterns)
library(BSgenome.Hsapiens.UCSC.hg38)
tumor_cytoband <- read.cytoband(species = "hg38")$df %>% filter(!(V1 %in% c('chrX', 'chrY')))
organoid_cytoband <- read.cytoband(species = "hg38")$df %>% filter(!(V1 %in% c('chrX', 'chrY')))
tumor_cytoband[ ,1] <- paste0("tumor_", tumor_cytoband[, 1])
organoid_cytoband[ ,1] <- paste0("organoid_", organoid_cytoband[, 1])
cytoband <- rbind(tumor_cytoband, organoid_cytoband)
t_sample <- "tumor"
o_sample <- "pdo"
vcfs <- read_vcfs_as_granges(
c(
'tumor.vcf',
'pdo.vcf'
),
c(t_sample, o_sample),
"BSgenome.Hsapiens.UCSC.hg38"
)
mut_data <- rbind(
data.frame(vcfs[[t_sample]]) %>%
mutate(value = 1) %>%
mutate(seqnames = str_c("tumor_", seqnames)) %>%
select(seqnames, start, end, value),
data.frame(vcfs[[o_sample]]) %>%
mutate(value = 1) %>%
mutate(seqnames = str_c("organoid_", seqnames)) %>%
select(seqnames, start, end, value)
)
cnv_data <- rbind(
read.table(
"tumor.cnvkit.call.cns",
sep="\t", header = T
) %>%
mutate(value = cn) %>%
mutate(chromosome = str_c("tumor_", chromosome)) %>%
select(chromosome, start, end, value),
read.table(
"pdo.cnvkit.call.cns",
sep="\t", header = T
) %>%
mutate(value = cn) %>%
mutate(chromosome = str_c("organoid_", chromosome)) %>%
select(chromosome, start, end, value)
) %>% mutate(value = pmin(value, 4))
cov_data <- rbind(
read.table("tumor.cnvkit.cov.cnn", sep="\t", header = T) %>%
mutate(value = log2) %>%
mutate(chromosome = str_c("tumor_", chromosome)) %>%
select(chromosome, start, end, value),
read.table("pdo.cnvkit.cov.cnn", sep="\t", header = T) %>%
mutate(value = log2) %>%
mutate(chromosome = str_c("organoid_", chromosome)) %>%
select(chromosome, start, end, value)
)
red <- "#FFC6D6"
blue <- "#bebcff"
green <- "#9CCF83"
orange <- "#fbd988ff"
purpule <- "#ff726dff"
black <- "#000000"
png(filename = "demo.circos.png", width = 1200, height = 1200, res = 200)
chromosome.index = c(
paste0("tumor_chr", c(1:22)),
rev(paste0("organoid_chr", c(1:22)))
)
circos.par(gap.after = c(rep(1, 22), rep(1, 22)))
circos.initializeWithIdeogram(
cytoband,
plotType = NULL,
chromosome.index = chromosome.index
)
circos.track(
ylim = c(0, 1),
panel.fun = function(x, y) {
circos.text(CELL_META$xcenter, CELL_META$ylim[2] + mm_y(2),
gsub(".*chr", "", CELL_META$sector.index), cex = 0.6, niceFacing = TRUE)
},
track.height = mm_h(1),
cell.padding = c(0, 0, 0, 0),
bg.border = NA
)
highlight.chromosome(paste0("tumor_chr", c(1:22)), col = red, track.index = 1)
highlight.chromosome(paste0("organoid_chr", c(1:22)), col = blue, track.index = 1)
circos.genomicIdeogram(cytoband)
circos.genomicDensity(cov_data, col=orange, track.height = 0.1, window.size = 1e7)
circos.genomicTrackPlotRegion(
cnv_data,
ylim = c(0, 4),
panel.fun = function(region, value, ...) {
cell.xlim = get.cell.meta.data("cell.xlim")
for(h in c(0, 1, 2, 3, 4)) {
circos.lines(cell.xlim, c(h, h), col = black)
}
col = ifelse(value[[1]] > 2, "red",
ifelse(value[[1]] == 2, "green", "blue")
)
i = getI(...)
circos.genomicRect(region, value, col = col, ytop = value + 0.3, ybottom = value - 0.3 , border = NA)
},
track.height = 0.1
)
circos.genomicDensity(mut_data, col=purpule, track.height = 0.1, window.size = 1e7)
text(0, 0.2, "Demo", cex = 2, font = 2)
text(-0.9, -0.8, "Tumor\nGenome")
text(0.9, 0.8, "Organoid\nGenome")
legend(
x = 0,
y = 0,
legend = c("Coverage", "CNV gain", "CNV neutral", "CNV loss", "Mutation density"),
col = c(orange, "red", "green", "blue", purpule),
pch = 15,
pt.cex = 1,
cex = 0.8,
bty = "n",
xjust = 0.5,
)
circos.clear()
dev.off()
|


