MultiQC is a tool for NGS data quality control. Unlike many other tools, it does not directly obtain and calculate metrics; instead, it reads results files from various common quality control tools and provides comprehensive reporting.
Currently, MultiQC supports 75 types of tools, with the ability to add more information (although I haven’t tried it yet). It covers the entire process from base calling to mutation detection, and the reports generated are very aesthetically pleasing, making them ideal for final data quality summaries.
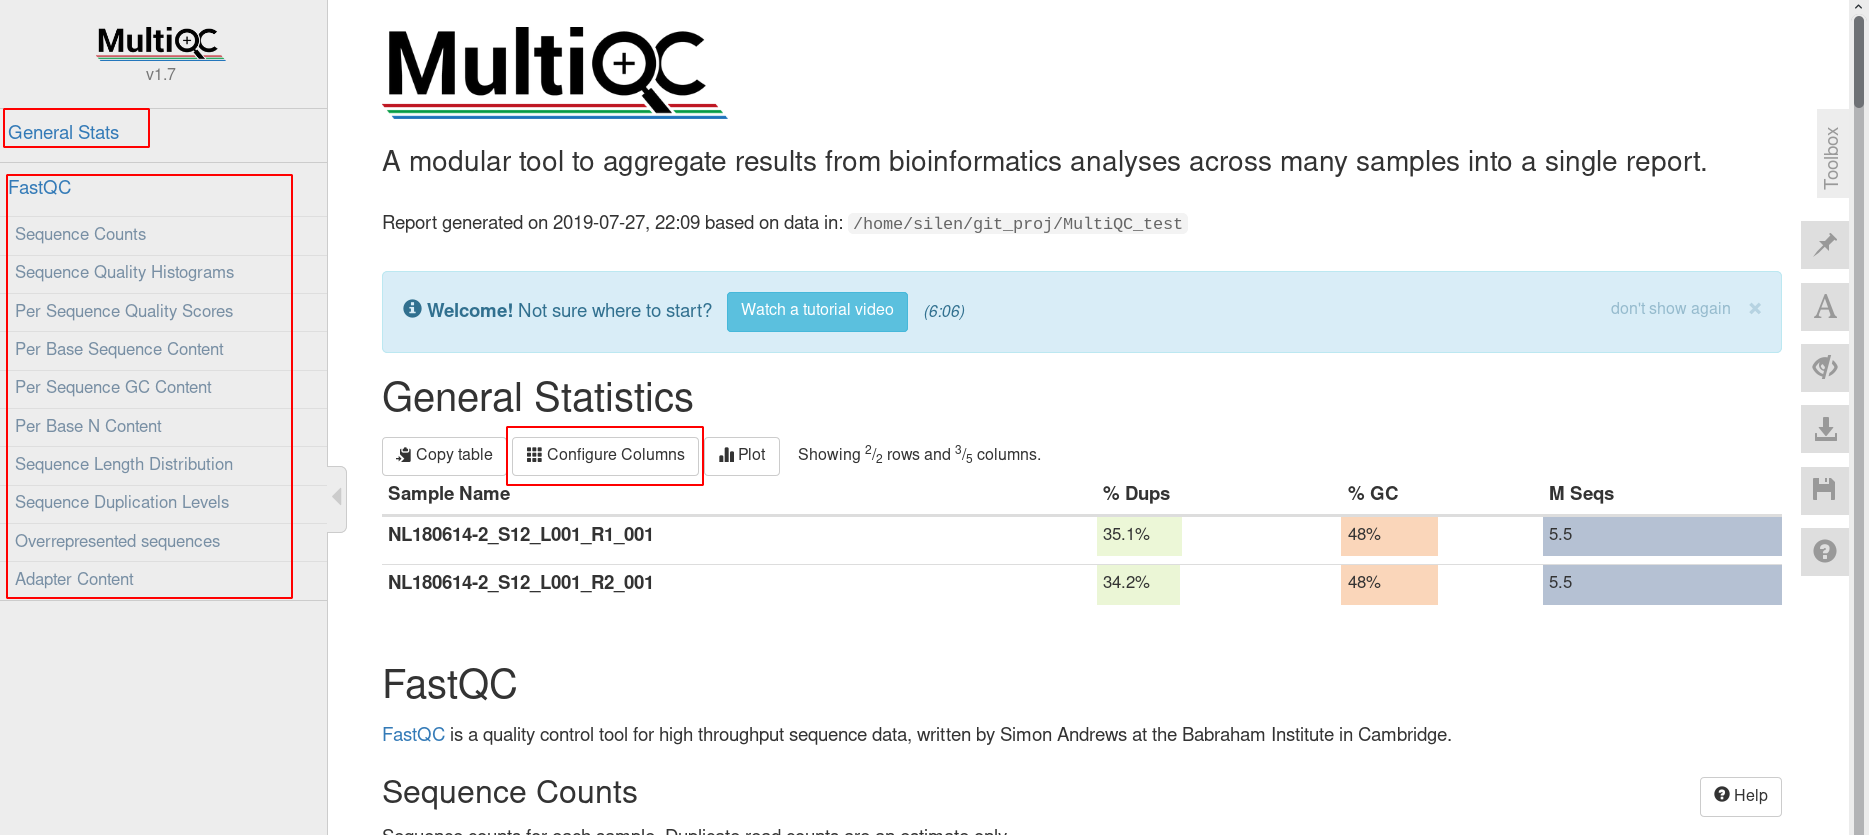
MultiQC’s usage is quite simple. First, place the result files from other tools in a unified directory. Then run MultiQC /path/to/file, and MultiQC will search for various quality control results in the folder and generate the final summary report. For example, I have a report generated by MultiQC using FastQC results:

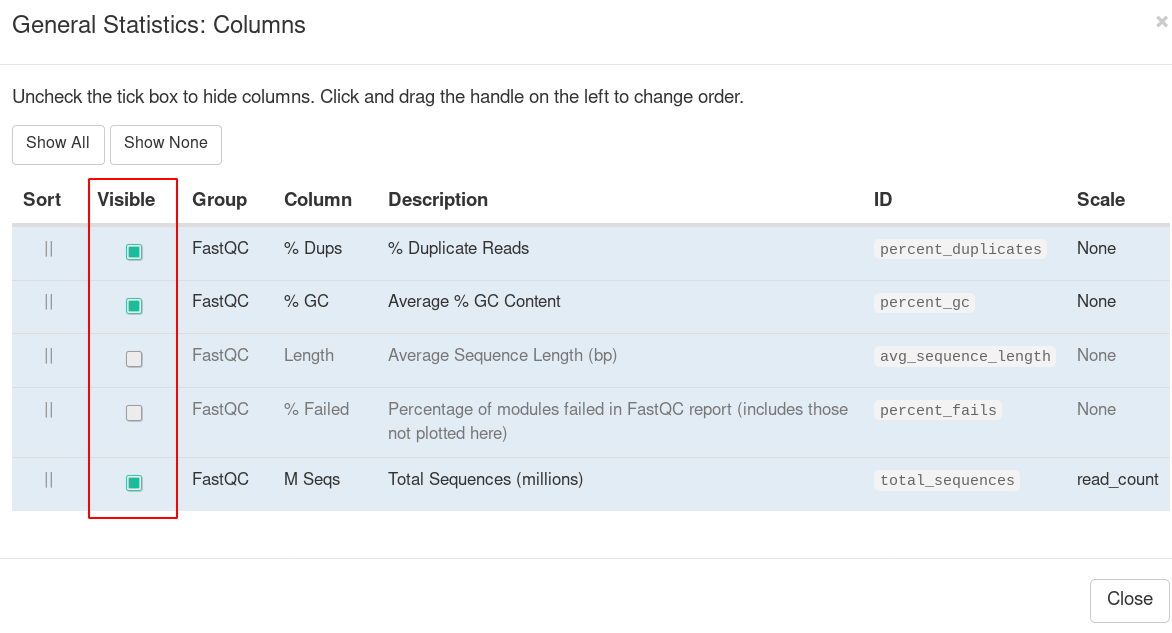
You can see that the entire report is very beautiful. At the top of the report, there is a table summarizing various metrics. On the left side is a navigation bar showing calculated metrics for different software. Depending on the software used, specific content may be displayed as charts or tables. In the top summary table, by default, only some metrics are shown. If you want to change the selected metrics, click configure columns to adjust which metrics need to be displayed.

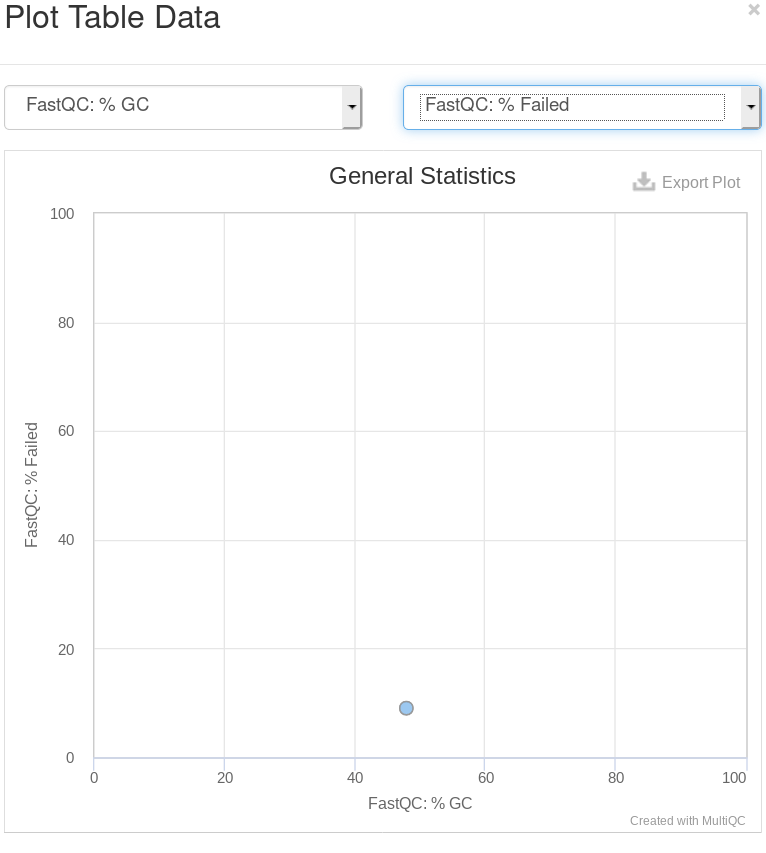
Another convenient feature is that you can click the plot button to select two metrics from the summary table for a scatter plot. This feature will be particularly useful when checking for anomalies later.

That’s all for a simple introduction. For more advanced usage, such as customizing new metrics and changing sample name matching rules to consolidate results from the same samples, I will continue to update this post with new findings.


